How does today’s reading change meaning when you can see the path that led to it?
From a reading to a sequence
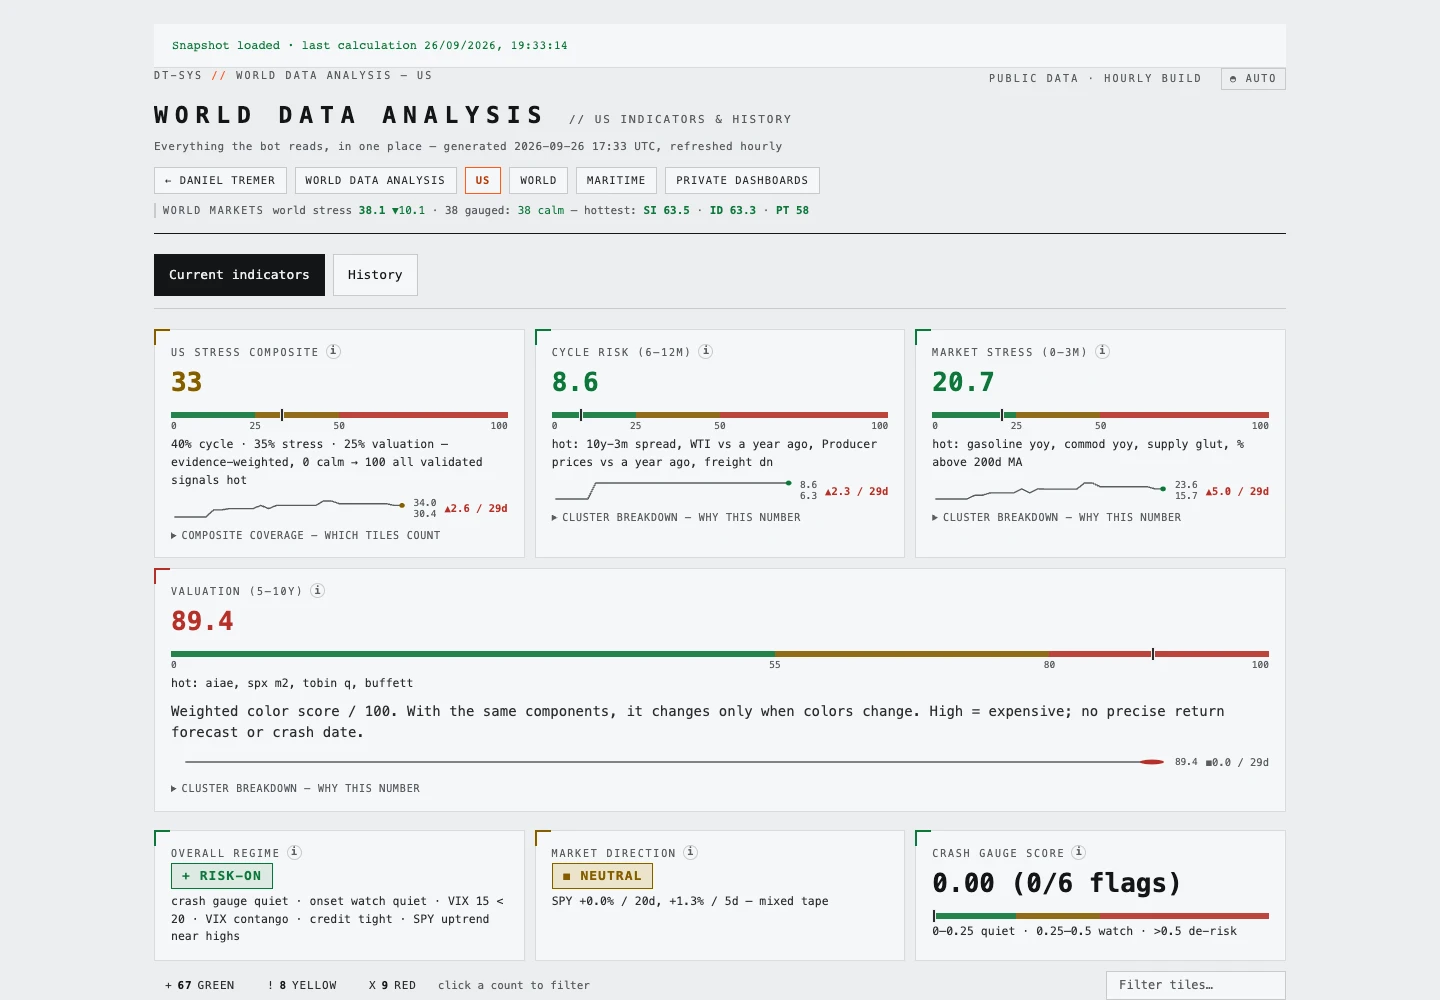
The US History Dashboard adds a time dimension to the current-indicator view. It opens directly in the US dashboard’s History tab, where recorded readings can be explored across different windows instead of being reduced to the latest number.
The overview compares the US stress composite with its cycle, stress and valuation components. Seeing those lines together helps reveal whether a change is broad or concentrated in one part of the picture.
Choose the scale of the question
Time-window controls let you switch between shorter and longer views, while a signal filter narrows the display. Charts are accompanied by data tables, and selected history can be exported for further inspection.
Background bands provide market-drawdown context. They help place indicator movements alongside market conditions without treating a visual relationship as proof that one predicted the other.
A history has its own provenance
The page distinguishes days with fresh readings, carried-forward observations and gaps. That matters when interpreting a flat line: an unchanged value can mean that no new source observation arrived. This is a way to inspect the recorded series and its coverage, rather than assume every plotted day is an independent measurement.